

Sean Ward -Data Analyst-
There I am exploring with my son, James!
Greetings! My name is Sean Ward and I currently live in Pittsburgh, PA. I am a data analyst with a background in sales-driven retail management. I have spent most of my retail career making informed decisions based on weekly analysis of sales trends. I enjoyed this part of my job so much that I decided to enter the world of data analytics in order to become more involved in a company’s problem solving.
I enjoy going for long walks with my family, listening to music and writing poetry. I think of my poetry as being a constant journey for meaning and I take this adventurous spirit into the analytical work that I do.
PROJECTS 2024-2025
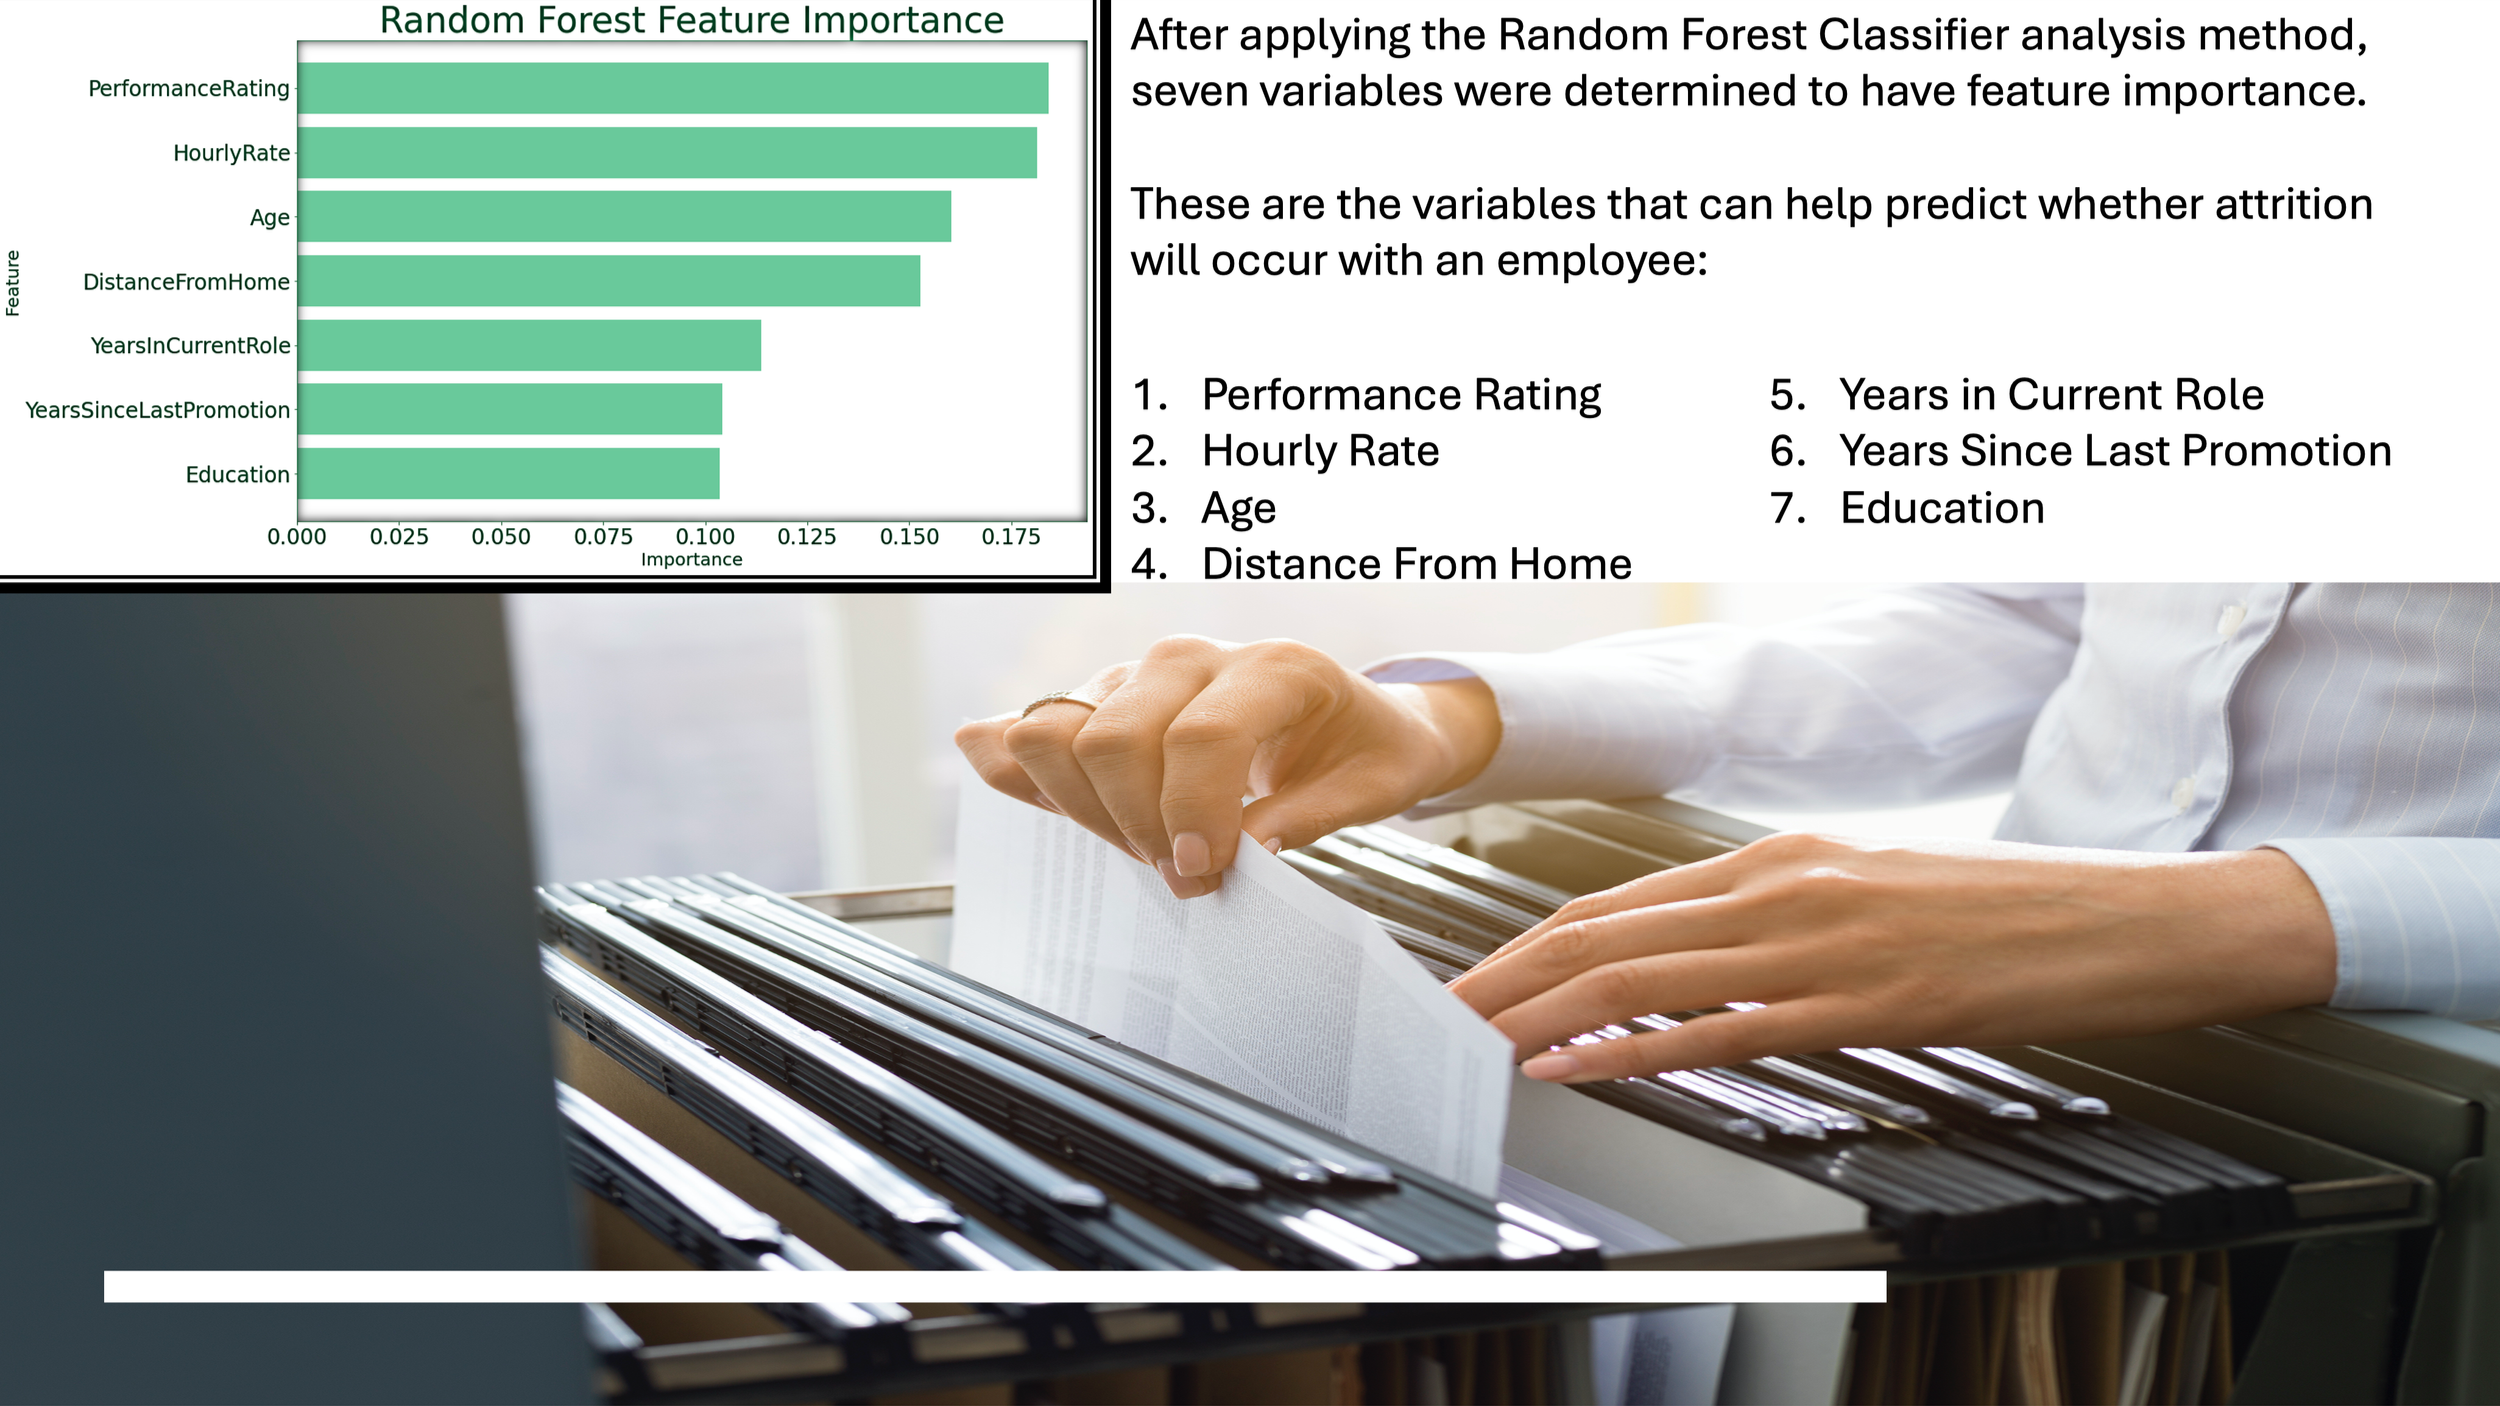
These are some of the projects that I accomplished as part of the Data Analytics Bachelors Degree Online Program at Southern New Hampshire University.
HR Attrition Analysis
PROJECTS 2022-2023

My first project for the engaging online “Data Analyst Nanodegree”program from Udacity. Delving into TMDB (The Movie Database) statistics regarding 10,000 movies from 1960 until 2015 using Python. Wrangling the data into shape to look at the interplay between revenue/budget (both actual and adjusted due to inflation) and vote averages.
Investigating Movie Revenues, Budgets, and TMDB Vote Averages Over Time
PROJECTS 2020-2021

This is a collection of my projects done for my fantastic CareerFoundry course (Data Immersion) online. This includes descriptive analysis in Excel with video game data, analyzing influenza data in Excel then creating visualizations through Tableau, and generating customer spending habit statistics with the use of SQL. I also used exploratory analysis, wrangled and merged grocery data through Python and used advanced visual analysis within Python to explore the vast Covid-19 statistics regarding tests, cases, and deaths.
My Portfolio
BLOG

I will be writing a blog every few weeks reflecting on past projects, and journeying through current projects. I want to make a blog that you don’t have to be an expert Data Analyst genius to enjoy…
Boston vs. Seattle… MLB? Nah…it’s Airbnb!
an excerpt:
“Boston and Seattle. Two very popular places to visit. Large cities on the water. How different can they be?
I won’t be answering that question today…
My question today is…how different can they Airbnb? Well, looking at Airbnb data, they are quite different indeed.”
FEATURED PROJECT

This was one of the achievement projects for my Data Immersion course on Career Foundry focused on preparing and analyzing data in Excel and then creating visualizations to tell a story in Tableau. The goal was to help a medical staffing agency determine where and when to send temporary workers during influenza season in the United States.